hist

以下の hist.gphist.dat を用意する.

hist.gp

gnuplotスクリプト

 1
 2
 3
 4
 5
 6
 7
 8
 9
10
11
12
13
14
15
16
17
18
19
# usage: cat hist.gp | gnuplot
#
reset

#set term post eps enhanced color solid font "Times-Roman, 10" size 1.7,1.5
#set output "hist.eps"

set term png
set output "hist.png"

set style data hist
set style fill solid 1.0 border -1

set yrange [0:*]

set ylabel "Y value"
plot for [i=2:4] "hist.dat" using i:xtic(1) title col(i)

# system("epstopdf hist.eps")

hist.dat

データファイル

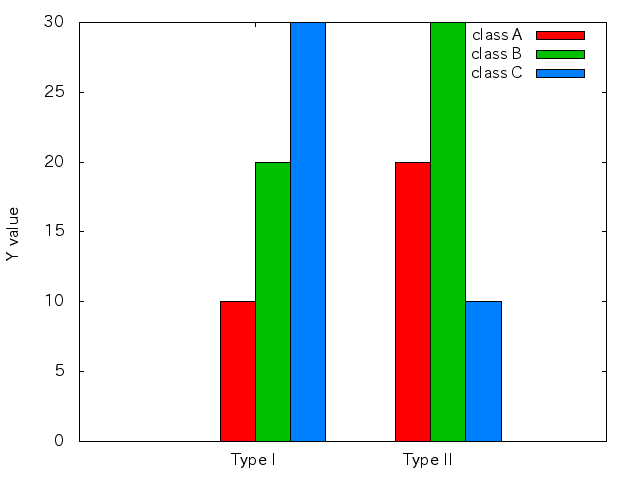
"type" "class A" "class B" "class C"
"Type I" 10 20 30
"Type II" 20 30 10

generate histograms

そして,以下のコマンドでgnuplotを実行して,png画像を生成する.コメントを外せばpdfを作成できる.

cat hist.gp | gnuplot

Environment

  • Ubuntu 12.04.5
  • gnuplot 4.4